Introduction
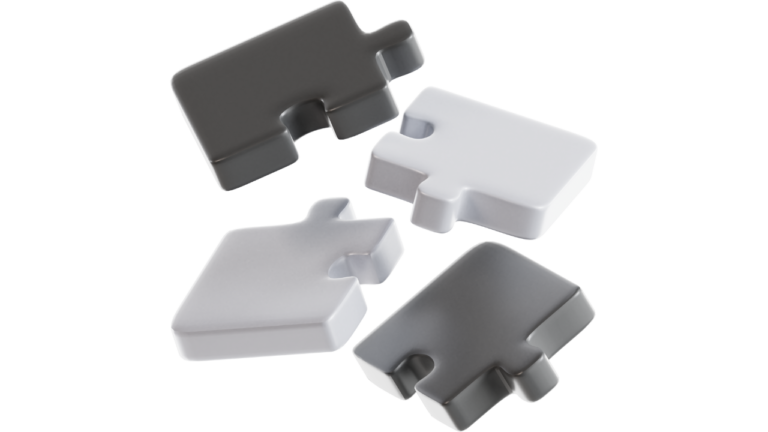
Imagine trying to assemble a jigsaw puzzle with pieces from multiple different puzzles, each piece crucial yet scattered across various boxes. Frustrating, right? Now, picture transforming every report of your company from “I don’t know what that is” to “that’s easy to understand,” seamlessly integrating every aspect of your business into one powerful dashboard.
If you want to monitor the important activities in your business with ease, like having a master puzzle solver who instantly knows where each piece fits, this article is for you. We’ll dive into how dashboards can give you clarity and insights into your own data, making your business operations as seamless as completing a perfect puzzle.
The chaos before Dashboards
When first starting your own business, you can be overwhelmed by the countless metrics and reports from different platforms. And it surely feels like trying to navigate a ship through a storm without any compass. Everything is chaotic, and you have no idea how to focus on taking your business to the next level.
This is the story of most small business owners: they either think they should track all possible metrics or not track anything at all. But discovering the power of correlating data into dashboards always helps their business finally take off.
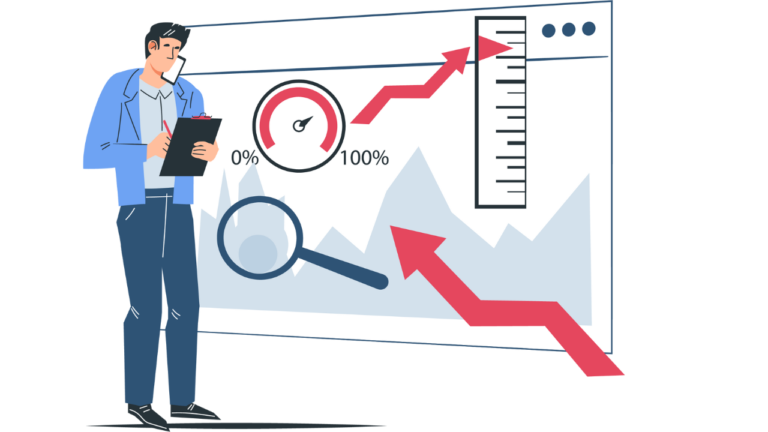
Overwhelmed by metrics
In a typical business, there are tons of metrics from marketing metrics like Facebook ads and website visitors, to sales metrics like cold leads and conversions. Then we have support metrics like unsolved tickets and customer satisfaction levels. That’s a lot to track, and we haven’t even touched the core business metrics related to your own product.
Think of the hiring process: you don’t fill all the positions at once. You add new roles as your company grows. Similarly, you can develop your own metrics step by step, adding the ones you need as you find use for them.
Remember, you can always view or listen to our content everywhere you are, on our channel.
The importance of tracking the right metrics
So, if you don’t have a good relationship with metrics yet, you just need to start and add the most important ones. But why is this so important?
If your company is growing, you need metrics to know what you’re doing right and how you can repeat and improve the process. If your company is not growing, you need metrics to find out the constraints and new ways to attack the problem.
Smart integration of dashboards
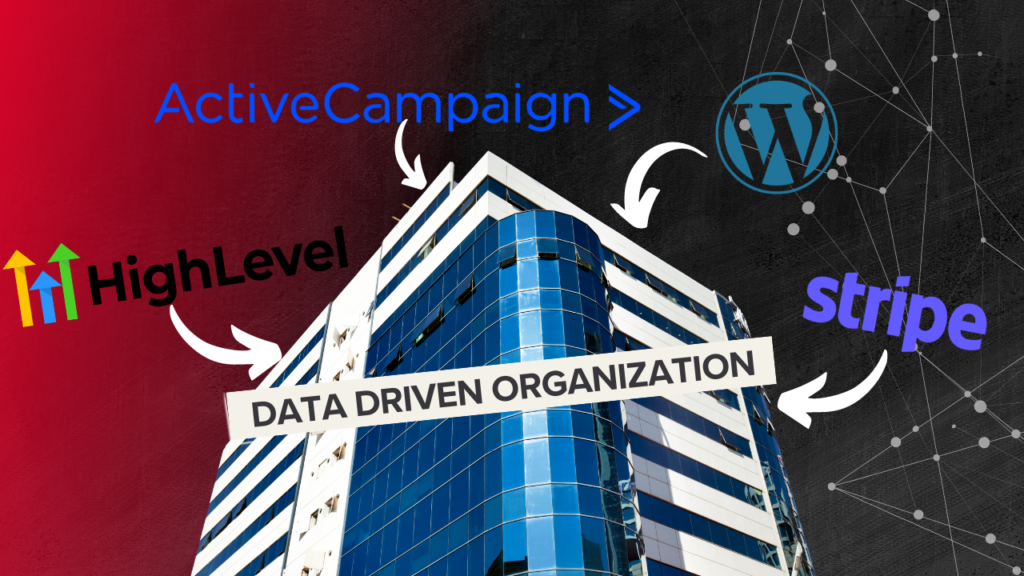
Most software solutions already have some metrics, but they often provide only partial information. For example, Google Analytics tells you how many people have visited your landing page. Your CRM shows how many leads you have, and your financial app shows how many customers have paid.
This fragmented data can become really messy when you’re trying to monitor the entire process. For example, how many buys do you have on an ad campaign?
Breaking down the dashboard solutions
Level one: The data is messy
External SaaS solutions like Meta Platforms and HubSpot provide tons of reports. Our job is to filter them out and keep only what’s relevant. This shouldn’t be a complex process. Just take a sheet of paper, write the important metrics down, and then filter those inside the corresponding platform. Now you’re at level one and can start your actual measurements.
Level two: The data is not correlated
What happens when you use different solutions, each with its own metrics? You need to connect the dots to have a unified source of truth. There are two steps to achieve this:
- Integrate your metrics. Tools like Zapier, Make, or even open-source solutions like N8n or ActivePieces can help you achieve this.
- Create interactive dashboards using custom code or an open-source solution like Superset or Metabase. This way, you have a centralized point to follow end-to-end flows.
Moreover, you can create such interactive dashboards for all of your departments, so they’ll have their own set of metrics to follow. Now you are at level two, but there is more.
Level Three: Making Data Understandable
What if the data is still too hard to understand and make correct decisions? The third level is making the data understandable. Since you have already done the integrations up to this point, you can easily use ChatGPT or a fine-tuned open-source model to help you get the insights you need.
This can be through a chat interface, email summary for the department manager, or an interactive dashboard component with interpretations. Managers can see the metrics, make assumptions, and then validate them with AI.
Making better business decisions
By leveraging the power of dashboards, you can transform the way you view and utilize your business data. Imagine having all your key metrics in one place, easy to understand and actionable. What if you could pinpoint exactly what’s working and what needs improvement?
Starting with filtering and organizing your metrics, then integrating them to create a unified source of truth, and finally making the data understandable through advanced tools like ChatGPT, you can gain invaluable insights.
Why struggle with fragmented data and unclear reports when you can have a comprehensive view of your business processes? Dashboards help you identify areas for improvement and make informed decisions that drive your business forward. Whether your company is growing or facing challenges, the right metrics and data integration can provide the clarity you need to succeed.
How do you start? Begin with the most important metrics and gradually build your dashboard to include a comprehensive view of your entire business process. With the right approach, dashboards will become a vital tool for achieving your business goals.